Highlights of the annual report 2018 of the CREG
On this page, you can find a summary of a number of important developments and salient facts from the CREG 2018 Annual Report. The full PDF version of the annual report can be downloaded here.
Key national legislative developments
The most important developments in legislation which took place in the area of natural gas and electricity in Belgium in 2018 relate to:
- the amendment of the legal framework for the strategic reserve
- the allocation of past balances of the federal contribution
- the amendment of the federal support mechanism for offshore wind energy
- the procedure for the domain concessions for the offshore installations of electricity transmission
- the amendment of the technical regulations
The electricity market
An overview of a number of key figures for the electricity market in 2018 determined on the basis of preliminary figures from various sources:
- Electricity offtake from the Elia grid was 76.7 TWh in 2018. This is around 1% less than the 77.4 TWh recorded in 2017. The peak capacity of this consumed energy was 12,440 MW, which is lower than what was recorded in 2017 (12,867 MW).
- Electricity generation on the Elia grid was 59.4 TWh, compared to 71.9 TWh in 2017. At 27.3 TWh, generation from nuclear power plants was significantly lower than in 2017 (40.2 TWh). Generation from natural gas was 19.3 TWh, compared to 18.8 TWh in 2017. Offshore wind farms generated 3.4 TWh, compared to 2.9 TWh in 2017. Market concentration on the generation side fell in 2018, but remains high in Belgium, with Electrabel having by far the largest share, at 69% of total generation.
- Net imports of electricity were 17.3 TWh, significantly more than net imports in 2017, which were just over 6 TWh. However, the record set in 2015 (21 TWh) remained intact.
- The electricity price on the short-term market was €55.3/MWh on average, an increase of around €10.7/MWh compared to 2017. In the Netherlands, Germany and France, the same upward trend can be seen in the short-term market. The average price gap on the short-term market between Belgium and Germany was €10.6/MWh in 2018, which was roughly the same as in 2017.

Average annual prices for the period 2007-2018 of the daily market for the supply of electricity in the countries of the CWE region (Sources: EPEX SPOT Belgium, EPEX SPOT, CREG calculations) - On the long-term market for electricity, the year-ahead price rose in 2018 to an average of €51.0/MWh, or roughly €13.7/MWh higher than in 2017. In 2018, the average price on the short-term market was higher than the average price of a year-ahead contract with delivery in 2018. This used to be the exception rather than the rule, but in recent years it has been more often the case.
- In 2018, flow-based market coupling improved significantly. This is thanks to the 20% minimum RAM measure, which significantly reduces the capacity of internal network elements, which are mainly used for domestic trade, to restrict cross-border trade. The splitting of the German-Austrian bidding zone from 1 October 2018 also ensured that even more network capacity in the CWE region is managed more efficiently through market coupling. The result of these developments was that Belgium achieved an import record of 5,196 MW, on 26 December 2018.
- Price convergence is maintained between the short-term market and positive and negative imbalance tariff.
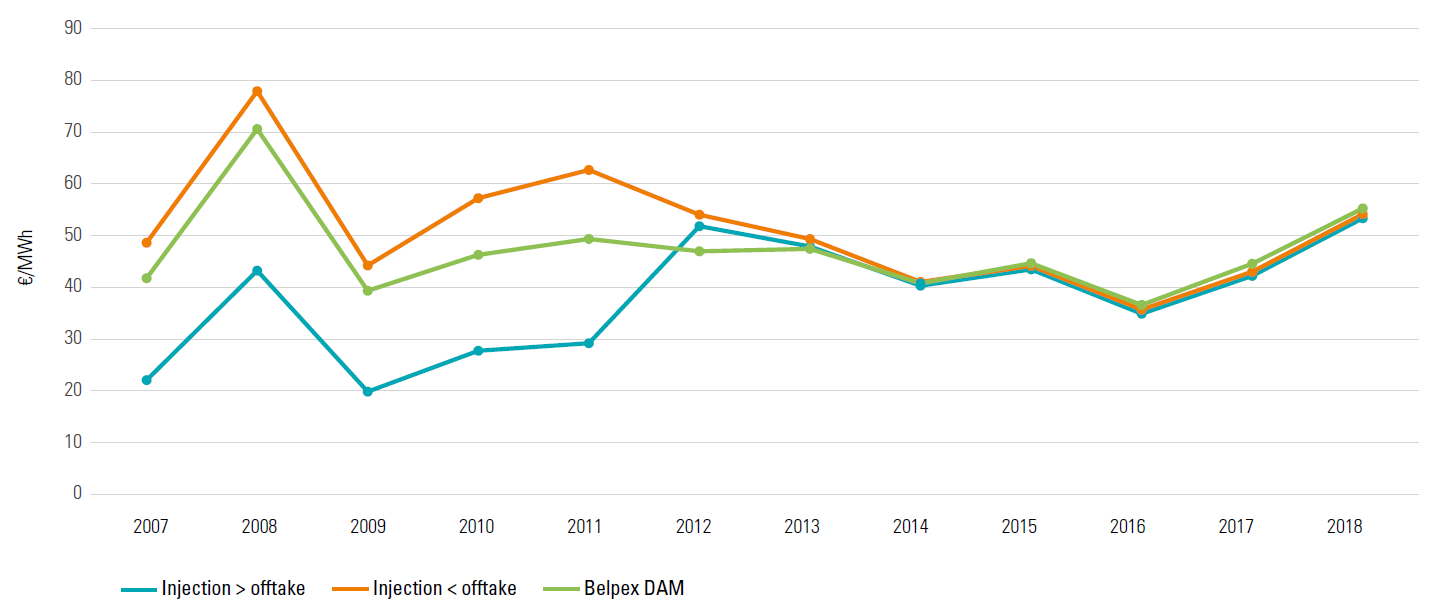
Average unweighted imbalance tariff and BELPEX DAM price during the period 2007-2018 (Sources: Elia and BELPEX/EPEX SPOT data)
The CREG continued to stress the consumer protection and information aspect of its work in 2018.
- The CREG Scan, an online tool launched in February 2017 and intended for private individuals, SMEs and the self-employed, enables consumers to check whether the contract they have signed up to in the past is an active or a dormant contract and where it stands in relation to the cheapest and most expensive product on the market today. The CREG Scan is easy to use and is complementary to existing price comparison websites, which only compare active electricity and natural gas products. The tool is aimed at ensuring that consumers make informed decisions and, especially, that they have full information.
- The CREG continued to provide consumers with information, in particular on prices and price trends, among other things thanks to the annual study on the evolution of the components of electricity and natural gas prices, the monitoring of prices in the energy market for households and small professional consumers, and the study on the supply of large industrial customers in Belgium in 2017.
- The CREG continued publishing the infographics and monthly dashboard for electricity and natural gas on its website, to provide consumers with all the necessary information to make a reasoned decision.
The REMIT regulation (Regulation on wholesale Energy Market Integrity and Transparency) sets out a series of instructions aimed at preventing and punishing market abuse in the wholesale energy sector. In 2018, the CREG validated various changes of registration. It also helped market players with their registration or other questions about REMIT. The CREG also conducted various investigations and ad hoc analyses on questions from market players about possible infringements of the REMIT Regulation.
Finally, the CREG adapted the hitherto applicable 2016-2019 tariff methodology, due to, firstly, the introduction of a legal framework for the Modular Offshore Grid in 2017, and secondly, the introduction of a new tariff guideline in the Electricity Act of 29 April 1999 to promote the development of electricity storage. These aim of these two legislative amendments is to handle the accelerated uptake of intermittent renewable generation resources.
On 28 June 2018, the CREG also approved the decision establishing the tariff methodology for determining the transmission tariffs for the period 2020-2023.
The natural gas market
An overview of a number of key figures for the electricity market in 2018 determined on the basis of preliminary figures from various sources:
- In 2018, total natural gas consumption amounted to 187 TWh, representing an increase of 3% compared with consumption in 2017 (182 TWh). Consumption by end consumers connected to the distribution system rose slightly (+1%) and consumption by industrial customers and consumption for electricity generation (possibly combined with heat generation) rose sharply (by 5.9% and 4.2% respectively).
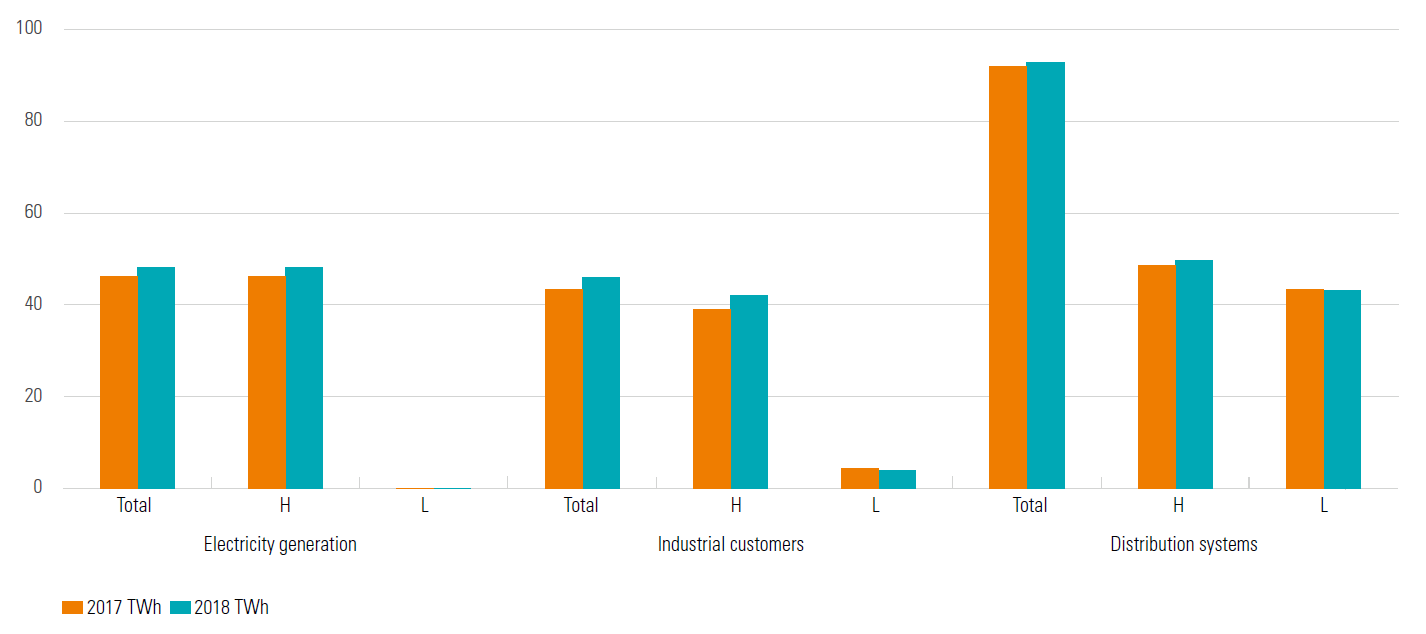
Distribution of Belgian H-gas and L-gas demand by user segment in 2017 and 2018 (Source: CREG) - When the CREG compared the annual average day-ahead price of natural gas (DAM) for the Belgian natural gas market ZTP (since 1 October 2015, ZTP also covers the Luxembourg natural gas market), the Dutch natural gas market TTF and two German natural gas markets Gaspool and NCG, it observed that prices on the short-term market were higher than prices on the long-term market in 2018. Average gas prices on the short-term market in Belgium and abroad were at a similar level, with a difference of 0.8% between NCG and ZTP.

Average annual natural gas price on the day-ahead and year-ahead markets (Sources: CREG, data taken from icis.com, ice.com, eex.com and powernext.com)
In 2018, the CREG conducted a new study into natural gas supply to large industrial customers in Belgium. These customers, which are connected directly to the Fluxys Belgium transmission system, accounted for 24% of consumption by Belgian end consumers in 2017. Analysis of the supply contracts shows that short-term contracts (with a duration of 1 or 2 years) are primarily entered into. In 2017, supply contracts of 2 years are the most common, entered into in 42% of cases, followed by contracts of 1 year, entered into in 24% of cases. Contracts with variable prices based on quoted gas prices account for more than 90% of customers. Around 8% of customers have a fixed price contract and approximately 1% have a fixed price contract indexed to quoted oil prices. The CREG observes more widespread use of quoted natural gas prices, both upstream (supply contracts) and downstream (sales contracts). Given the HHI index, which fell back to 2,411 in 2017, the lowest level in the study period (2007-2017), the market for industrial customers directly connected to the Fluxys Belgium grid remains dynamic and competitive. In view of the significant drop in volumes that were the subject of supplier changes in 2017, the switching rates still need to be monitored.
The CREG conducted a study into the prices in force on the Belgian natural gas market in which it analysed market shares, price formation, price levels, price breakdown and billing in the different sectors of the Belgian natural gas market in 2017.
The CREG likewise continued to emphasise improving the functioning of the natural gas market, in order to protect the interests of consumers. These aspects are presented in the chapter Electricity.
Finally, on 28 June 2018, the CREG approved the decision establishing the tariff methodology for determining the transmission, storage and LNG tariffs for the period 2020-2023.
The CREG
This chapter describes the functioning of the CREG and the close relations it maintains with other national and international bodies.
It also contains a list of the acts which the Board of Directors approved in 2018.