Highlights of the annual report 2019 of the CREG
On this page, you can find a summary of a number of important developments and salient facts from the CREG 2019 Annual Report. The full PDF version of the annual report can be downloaded here.
Key national legislative developments
The most important developments in legislation which took place in the area of electricity and natural gas in Belgium in 2019 relate to:
- the capacity payment mechanism
- offshore wind energy
- the introduction of a competitive tendering procedure
- the payment system for farms connected to the MOG
- the social tariffs for gas and electricity
- monitoring by the CREG of energy intermediaries
- the amendment of the technical regulations
The electricity market
An overview of a number of key figures for the electricity market in 2019 determined on the basis of preliminary figures from various sources:
- Electricity offtake from the Elia grid was 74.2 TWh in 2019. This is around 3.2% less than the 76.7 TWh recorded last year. The peak capacity of this consumed energy was 12,568 MW, slightly higher than what was recorded in 2018 (12,440 MW).
- Electricity generation on the Elia grid was 75.8 TWh, compared to 57.8 TWh in 2018. As a result of their higher availability compared to 2018, generation by nuclear power plants increased by 50% (41.4 TWh compared to 27.3 TWh). The natural gas-fired units produced 20.3 TWh, a limited increase (1.0 TWh) compared to 2018. Offshore wind farms generated 4.8 TWh, compared to 3.4 TWh in 2018. Market concentration on the generation side grew slightly compared to 2018 and remains high in Belgium, with Electrabel having by far the largest share, at 69% of total generation.
- Net exports of electricity were 1.8 TWh compared to net imports of 17.3 TWh in 2018. The last time Belgium was a net exporter on an annual basis was 2009.
- In 2019, the average daily market price in Belgium was €39.3/MWh, higher than the €39.5/MWh in France and the €41.2/MWh in the Netherlands. By way of comparison, in 2018 the daily market price in Belgium was €55.3/MWh. The average German daily market price in 2019 also fell compared to 2018, but at €37.7/MWh remained the lowest in the CWE region. However, the fall in the price on the daily market was strongest in Belgium.

Average annual prices for the period 2007-2019 of the daily market for the supply of electricity in the countries of the CWE region (Sources: EPEX SPOT Belgium, EPEX SPOT, CREG calculations) - In the long-term electricity market, the year-ahead price for supply in 2019 averaged €51.0/MWh and remained at the same level as in 2018. In 2019, the average price on the short-term market was therefore slightly lower than the average price of a year-ahead contract with delivery in 2019. This is in contrast to recent years in which the price on the short-term market was often higher than the year-ahead price.
- The most striking change in the area of interconnection is arguably the commissioning of NEMO Link on 31 January 2019. Via this HVDC cable connecting Belgium to the United Kingdom, the Belgian bidding zone is incorporated into the Channel market coupling. Based on the provisional figures, the available capacity averaged 874 MW for exports and 846 MW for imports, of which 86% was used commercially, mainly for exports.
- Price convergence was also maintained in 2019 between the short-term market and the positive and negative imbalance tariffs. The price differences even decreased slightly.
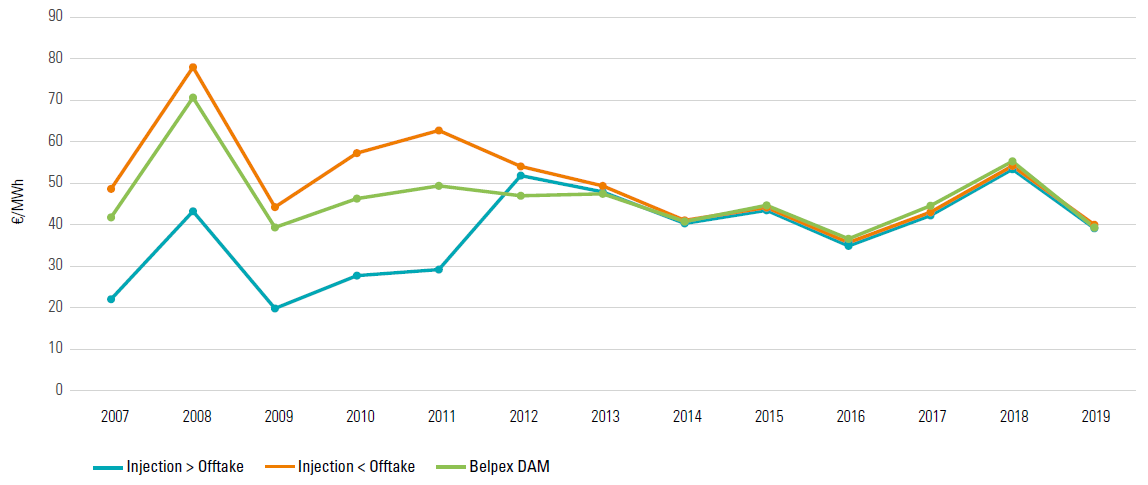
Average unweighted imbalance tariff and Belpex DAM price during the period 2007-2019 (Sources: Elia data and BELPEX/EPEX SPOT)
The CREG continued to stress the consumer protection and information aspect of its work in 2019.
- Launched in February 2017, the CREG Scan is intended for individuals, SMEs and the self-employed, with a maximum annual consumption of 50,000 kWh for electricity and/or 100,000 kWh for natural gas. With the launch of the CREG Scan, the CREG wanted to offer consumers a unique and useful tool with which they could compare dormant contracts with current market offerings, in six clicks. Something that is not possible on the other price comparison websites, as only the current offering can be seen there. The CREG Scan now has a much broader scope, as it also covers group purchases (330,000 households) and cooperative contracts (70,000 households). Moreover, since this year the user can differentiate between fixed and variable price contracts, which makes comparison easier. In 2019, the CREG Scan compared a total of 13,200 (active and dormant) products, while other price comparison websites only take into account the 664 active products on the market.
- The CREG continued to provide consumers with information, in particular on prices and price trends, among other things thanks to the annual study on the evolution of the components of electricity and natural gas prices, the monitoring of prices in the energy market for households and small professional consumers, and the study on the supply of large industrial customers in Belgium in 2018.
- The CREG continued publishing the infographics and monthly dashboard for electricity and natural gas on its website, to provide consumers with all the necessary information to make a reasoned decision.
- The REMIT regulation (Regulation on wholesale Energy Market Integrity and Transparency) lays down a series of instructions aimed at preventing and punishing market abuse in the wholesale energy sector. In this context, the market players need to register on a platform and keep their registration details up to date. In 2019, the CREG validated several changes to the registration, among other things as a result of the uncertainty surrounding the withdrawal of the United Kingdom from the EU. It also helped market players with their registration or with other questions about REMIT. In 2019, the CREG also conducted various investigations and ad hoc analyses on questions from market players, or on their own initiative, about possible infringements of the REMIT Regulation.
- On 7 November 2019, the CREG approved Elia's adapted tariff proposal for the regulatory period 2020-2023. Overall, compared to current transmission system tariffs for 2019, the decrease in tariffs is -2.1% in 2020, -1.9% in 2021, -1.1% in 2022 and -1% in 2023.
The natural gas market
The most important aspects of the natural gas market in 2019 are:
- In 2019, total natural gas consumption amounted to 193 TWh, representing an increase of 3% compared with consumption in 2018 (187 TWh). A slight increase in consumption by end consumers connected to the distribution systems was observed (+ 0.4%), as was a strong increase in consumption by industrial customers (+ 7.2%) and consumption for electricity generation (possibly in combination with heat production) (+ 4.1%).
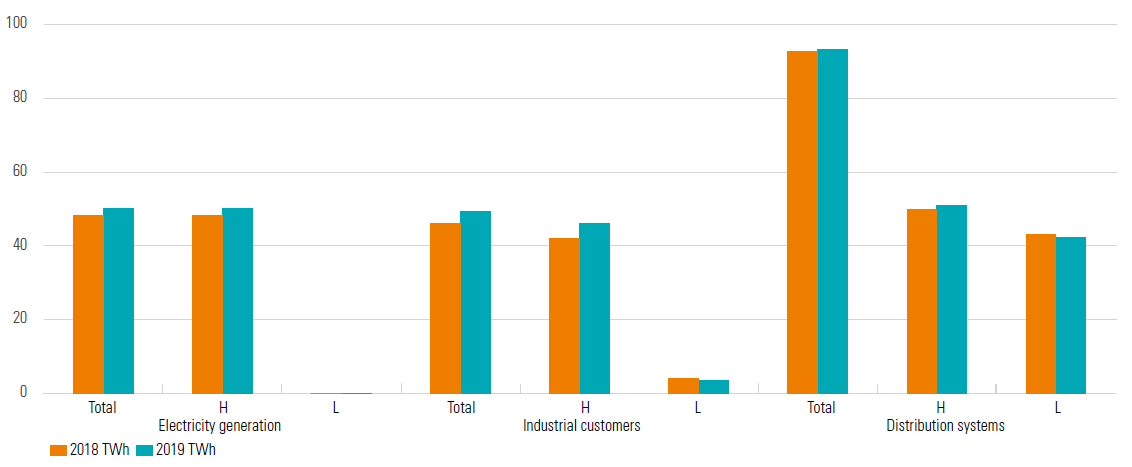
Distribution of Belgian H gas and L gas demand by user segment in 2018 and 2019 (Source: CREG) - The expansion of the Zeebrugge LNG terminal was completed in December 2019 to respond to the development of the LNG market. The commissioning of the fifth tank with a capacity of 180,000 m³ LNG will increase the maximum storage capacity of the terminal from 386,000 to 566,000 m³ LNG. In 2019, activity at the Zeebrugge LNG terminal reached a record level with 90 LNG tankers unloading 95 TWh of LNG, 72.7 of which were injected into the Belgian gas network.
- The average gas price on the short-term market fell sharply from €23.0/MWh in 2018 to €13.7/MWh in 2019 and the average gas price on the long-term market fell, but to a lesser extent, from €20.8/MWh to €18.6/MWh, but these prices did not quite reach the 2009 lows of around €12 and €18/MWh respectively. In 2019, the trend was therefore reversed and prices on the short-term market were lower than on the long-term market. Average gas prices on the short-term market in Belgium and abroad were at a similar level, with a difference of 0.1% between NCG and ZTP.

Average annual natural gas price on the day-ahead and year-ahead markets (Sources: CREG, data taken from icis.com, ice.com, eex.com and powernext.com) - The CREG carried out a study on the prices in force on the Belgian natural gas market in which it analysed market shares, price setting, price levels, price breakdown and billing in the different segments (import, resale, supply of residential customers, industrial customers and power plants) of the Belgian natural gas market in 2018.
- The CREG continued to emphasise improving the functioning of the natural gas market, in order to protect the interests of consumers. These aspects are presented in the chapter Electricity.
- On 7 May 2019, the CREG approved Fluxys Belgium's tariff proposal for natural gas transmission tariffs for the regulatory period 2020-2023. The new tariffs have fallen compared to the previous regulatory period, for the fifth time in a row. For an average Belgian customer, the tariffs for 2020-2023 will be approximately 5% lower than the indexed tariffs for 2019.


The CREG
This chapter describes the functioning of the CREG and the close relations it maintains with other national and international bodies.
It also contains a list of the acts which the Board of Directors approved in 2019.